
Why this report matters for homeowners
Flood is Australia’s most expensive natural hazard, and the numbers keep stacking up. The Insurance Council’s 2024–25 report sets out how many homes are exposed, what recent seasons cost, and why that flows through to your premium and your rebuild choices.
Around 1.36 million properties face some level of flood risk nationwide, and a large subset sit in the severe–extreme bands (Report, p. 2, 26–27). Recent extreme-weather losses have climbed to roughly $22.5 b over five years—about a 67% jump—driven by more assets in harm’s way, higher rebuild costs, and repeated events (Report, p. 2–3).
For the 2024–25 period alone, insurers recorded about $1.97 b in incurred losses across roughly 154,100 claims, with an average claim near $13,000. Most of that value was on personal lines—regular households—so it’s not just big business absorbing the hits.
What does that mean for you?
Premium pressure, stricter underwriting in hot spots, and harder choices after a flood: repair as-is, lift the home, or change materials and services so the next event does less damage. The report doesn’t shy away from pointing out that where exposure remains high, pricing will reflect it.
Australia’s flood bill in plain language
When you hear billion-dollar loss figures, it’s easy to tune out. Here’s what they mean for a household budget.
Losses keep climbing because we’ve put more (and more expensive) assets in risky places, rebuild costs have risen, and some regions are getting hit again before they’ve fully recovered. Even when the weather isn’t record-breaking, a flood that reaches a denser suburb with pricier homes, cars, and contents generates a far bigger bill than the same depth of water thirty years ago.
Zooming out, Australia sits near the top globally for per-capita extreme-weather losses across decades, which makes the insurance market here more exposed to volatility. That exposure matters because local insurers buy reinsurance—insurance for insurers—to spread risk. When global insurers face higher catastrophe costs, they charge more.
Those higher wholesale costs flow through to retail premiums, especially in the suburbs with the worst flood histories.
So premiums aren’t just “price hikes”; they’re a signal of risk and the true cost to repair or replace what’s on the ground. Where exposure drops—through better planning, stronger standards, or household-level upgrades—pricing has room to move the right way.
Who bears the brunt: vulnerable communities
Flood risk and financial stress often overlap. The report estimates about 242,000 dwellings sit in the highest flood-risk bands, and more than 186,000 of these are not insured for flood—roughly 77% (Report, p. 10). In these areas, typical premiums can exceed $7,000 and, in some cases, $30,000, which pushes households to under insure or opt out of flood cover altogether.
The problem is compounded by taxes embedded in premiums—state stamp duty and, in New South Wales, the Emergency Services Levy—so the people paying the most for risk also pay more tax on top.
The report also links exposure to lower incomes: around 70% of households in the highest flood-risk cohort are in areas with below-median incomes, and roughly 35% are in areas below the poverty line (Report, p. 29). That combination—high hazard, high premiums, and lower capacity to pay—leads to gaps in cover and slower recovery.
What this means for you: if you’re in a mapped high-risk area, affordability pressures are real and the trade-offs are stark. But dropping flood cover altogether leaves you carrying the full rebuild risk.

2024–25 season at a glance: events and losses
The headline numbers are big, but the split by event helps explain repair time frames, claim sizes, and where resources went.
For 2024–25, the industry recorded about $1.97 b in incurred losses across roughly 154,100 claims, with an average claim close to $13,000. Around three-quarters of the value sat in personal lines—households like yours—so the recovery bottlenecks directly affected residential rebuilds and contents replacement.
Most of the season’s bill came from Ex-Tropical Cyclone Alfred (Cat 252): about $1.4 b, driven by widespread power loss, flash flooding, and coastal impacts. North Queensland floods (SE 251) added roughly $289 m, and the Mid-North Coast & Hunter event (Cat 253) another ~$248 m. Average claim size varied by event—higher where homes were inundated longer, access was delayed, or specialist assessments were needed.
What this means for you: claim timing depends on event location and damage profile. Where there’s large-scale power loss, contaminated floodwater, or hard-to-reach areas, assessments and trades stretch out, scopes change, and the average payout rises—all of which slows the queue for everyone.
What actually helps: the report’s policy fixes (and why they matter to you)
Big-picture reforms only matter if they change what you pay, whether you can get cover, and how fast communities recover. The report outlines a few levers with direct household impacts (Report, p. 26–29).
Flood Defence Fund & resilience programs. The Insurance Council proposes a decade-long national program—billions for levees, house-raising and retrofits, targeted buy-backs, and local infrastructure upgrades. These measures don’t just mop up after floods; they reduce exposure ahead of time. Where risk genuinely drops—think a suburb protected by a new levee, or a street of raised homes—insurers have more room to sharpen pricing or terms.
Stable disaster funding & governance. A rolling, indexed Disaster Ready Fund and better disaster governance would smooth out boom–bust investment cycles so mitigation isn’t left until after the next event. Predictable funding means councils can plan multi-year projects—drainage, detention basins, evacuation routes—rather than stop–start works that leave gaps.
Insurance taxes. Premium loadings like state stamp duty and, in NSW, the Emergency Services Levy, make already-expensive cover even harder to afford in high-risk postcodes. Removing or reforming these taxes would immediately lower the invoice households see, even before any shovels hit the ground on mitigation.
Better planning and stronger standards. The report argues for avoiding new homes in extreme-risk zones and progressively lifting building standards to handle known hazards—an approach the modelling suggests could save about $4 b a year nationally when fully implemented. For homeowners, that looks like minimum habitable floor levels in mapped areas, flood-compatible materials on lower storeys, and raised services—choices that reduce damage and downtime when water arrives.
What this means for you: Policy change is not abstract. If your street’s risk falls because of a levee or your home’s services are raised above flood level, you’ve reduced the size and likelihood of a claim—and that’s exactly the kind of change insurers can recognise in pricing and cover terms.

Practical home-level measures the report points toward
Not every fix needs a bulldozer. The report’s case studies and claims insights point to household steps that reduce damage, speed up claims, and, in some cases, help pricing over time (Report, p. 10–15, 22–25).
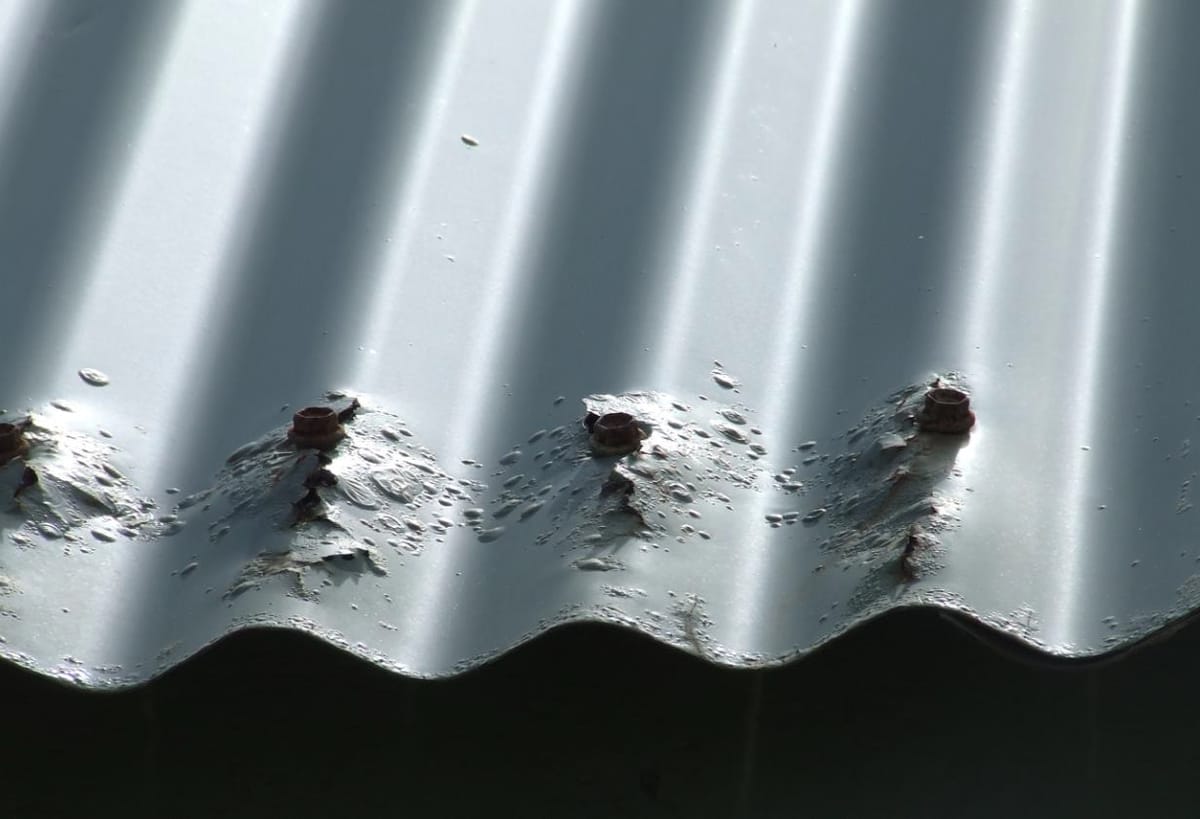
Target the hazard you actually face. If your risk is riverine flooding, think floor heights, house-raising, and keeping critical services above predicted levels. For overland flow, focus on site drainage, thresholds, and door/gully protection. Coastal areas need attention to storm-tide, corrosion, and power resilience (Report, p. 13–15).
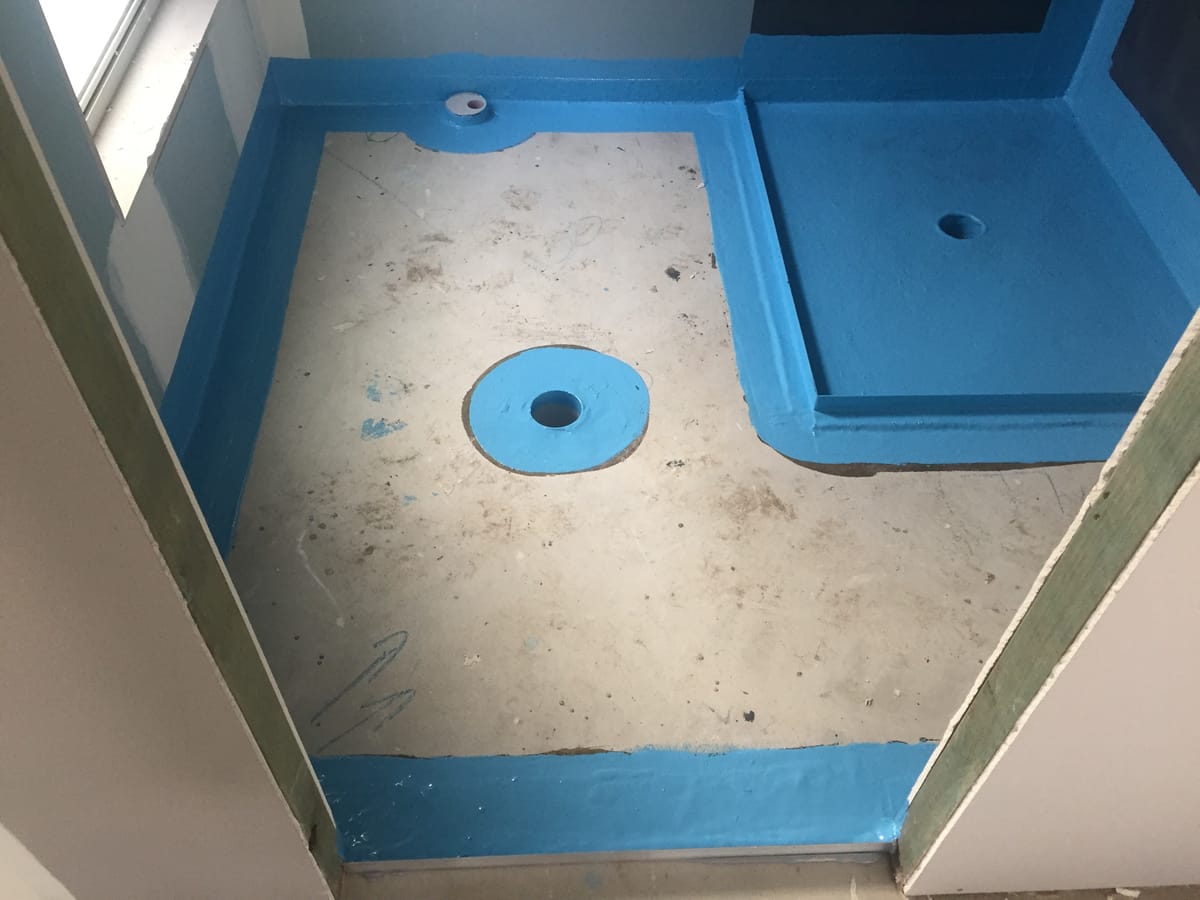
Protect services and the first metre. Raise switchboards, NBN/routers, hot-water systems and A/C outdoor units above mapped flood levels. Use flood-compatible materials at ground level—cement sheet linings, tile or vinyl with waterproof adhesives, and removable skirtings—so a wet room can be dried and re-finished without full demolition (Report, p. 13–15).
Control water paths. Maintain gutters and down pipes, shape fall away from the slab, clear yard drains, and install back flow prevention where plumbing allows. Small works here can keep shallow flows outside and reduce contamination inside (Report, p. 13–15).
Plan for outages. Widespread power loss can drive thousands of contents claims (food spoilage, electronics). Have an outage plan—coolers/ice, surge protection, and safe procedures for generators if you use them (Report, p. 13–15).
Document early, document well. The fastest claims shared the same traits: photos before clean-up, clear flood-height marks, and itemised contents. Keep maintenance invoices, building plans, and any prior scopes of work on file. If you need expert input (hydrology/engineering), ask for the report and keep it with your claim (Report, p. 22–25).
Know the process and your rights. The report highlights common pain points—communication, scope clarity, temporary accommodation, and how “like-for-right” is applied. If you disagree with a decision, you can request a review and use the formal complaints path (Report, p. 22–25).
Local rules still apply. In designated flood areas, councils often require minimum habitable floor levels and resilient finishes. Check the conditions on your development/building approval before you renovate (Report, p. 28–29).
What this means for you: Small, targeted changes reduce the size of the next claim and the time you’re out of your home. Over time, demonstrated risk reduction is exactly the kind of thing insurers can recognise in pricing and terms.

Navigating claims and community support
A smooth claim isn’t luck—it’s process
The report spells out where claims often bog down and what helped households move faster: clear communication, a documented scope of works, early temporary-accommodation planning, and access to expert reports when they’re needed (Report, p. 22–25).
Common pain points. Many complaints centre on not knowing what’s next, disputes over “like-for-right” scopes, delays waiting for assessors or trades, and uncertainty about temporary accommodation entitlements. Complex claims—structural issues, prolonged inundation, or contamination—often require hydrology or engineering input, which can extend timelines but leads to a more accurate scope.
What insurers did on the ground. Since July 2024, insurers have run 34 in-person events—town halls, recovery hubs, one-on-one sessions—to answer questions, collect documents, and escalate stuck files. Dedicated hubs operated in Townsville and Taree after major events. These forums cut down on back-and-forth emails and helped customers understand decisions.
Standards and safeguards. The industry is rewriting its Code of Practice and developing a vulnerability framework to better support customers in hardship or with accessibility needs (Report, p. 3, 24–25). Where expert evidence is needed, the report outlines a best-practice approach—clear instructions to experts, transparent reports, and sharing those reports with customers—so you’re not left guessing why a scope changed (Report, p. 24–25).
How to keep your claim moving:
- Ask for a written plan: Request a simple timeline showing assessment, scope, authorisation, and repair stages, with named contacts (Report, p. 22–23).
- Get the scope—and the “why”: Ask for the detailed scope of works and any expert reports used to create it. If the scope is provisional, note the triggers for change (Report, p. 24–25).
- Temporary accommodation: Confirm entitlements early, including duration and review points if repairs run long (Report, p. 22–23).
- Escalation path: If you disagree with a decision, use the internal dispute resolution process and keep dates, emails, and call notes. You have a formal complaints pathway if issues remain unresolved (Report, p. 22–23).
What this means for you: Clarity and paperwork win. The households that documented early, asked for scopes and reports, and used the escalation steps saw fewer surprises and quicker approvals.
Frequently Asked Questions
1) Why are flood premiums so high in some suburbs, and what can actually bring them down?
Premiums reflect exposure (where and how we build), the cost to repair/replace, and the wholesale price of reinsurance. High-risk postcodes—especially where homes have flooded repeatedly—see steeper pricing. What moves the needle: genuine risk reduction such as levees and drainage upgrades, raising homes or services above mapped levels, and stronger standards. Removing insurance taxes (stamp duty and the NSW ESL) would lower invoices immediately, independent of risk changes (Report, p. 4–9, 26–29).
2) What’s the difference between a “Significant Event” and an “Insurance Catastrophe”? Does it change my claim?
The report uses industry classifications to track and coordinate responses—e.g., Cat 252 for Ex-TC Alfred and SE 251 for the North Queensland floods. Your policy entitlements come from your Product Disclosure Statement and policy schedule, not the label attached to the event. The report doesn’t redefine benefits by label; it uses them for loss reporting and operational coordination (Report, p. 12, 18–19).
3) My area has flooded twice in five years—should I repair, raise the house, or consider relocation?
Where flooding repeats,“like-for-like” repairs can lead to the same loss cycle. The report points to house-raising and targeted buy-backs in extreme locations as part of a funded resilience program. Ask a designer/engineer to cost options and discuss with your insurer how each option affects insurability and pricing (Report, p. 16–17, 26–27).
4) Do insurers recognise specific home-level flood measures when pricing?
The report indicates that when exposure drops—through elevated floor levels/services, resilient materials, or community-scale works—pricing and terms have room to improve. It doesn’t list universal “credits,” so ask your insurer which measures they’ll recognise for your address and how they’ll record them on your file (Report, p. 24–25, 28–29).
5) Why did my claim need hydrologists or engineers, and why did it take longer than my neighbours’?
Complex claims—longer inundation, structural questions, or disputed water paths—often require expert reports. Access delays, contamination, and limited regional trades extend timelines. Expert findings can also change scopes mid-stream, which adds time but avoids under-repair (Report, p. 18–19, 24–25).
6) What documents should I keep ready before storm season to simplify claims?
Keep a “claims-ready” pack: policy schedule; photos of each room and contents; recent maintenance invoices; any building plans/floor levels; and an itemised contents list. After an event, photograph flood heights before clean-up and keep damaged-item evidence as asked (Report, p. 10–15, 22–23).
7) How do stamp duty and the NSW Emergency Services Levy (ESL) affect my premium?
They load tax on top of already high base premiums in riskier postcodes, worsening affordability. The report recommends reform/removal to reduce bills immediately while longer-term mitigation is built (Report, p. 28).
8) What support exists if I’m a vulnerable customer during a disaster?
The industry is rewriting its Code of Practice and developing a vulnerability framework. Insurers ran in-person hubs and town-halls to assist with documentation, escalation, and temporary-accommodation questions. If you need extra help, tell your insurer—process adjustments are part of the evolving framework (Report, p. 3, 22–25).
9) Will stronger building standards really save money overall?
According to the report’s cited modelling, progressively lifting standards to address known hazards could deliver about $4 b per year in national savings once fully implemented—through less damage and faster recovery (Report, p. 28–29).
10) Why do regional claims often take longer to resolve?
Distance and access constraints, fewer local assessors/trades, longer material lead times, and the need for specialist reports all stretch timelines. These factors also drive higher average claim sizes compared with metro events (Report, p. 18–19).
Further Reading


Member discussion